The Global Climate Change Debate - The Facts
Is the Earth really cooling?
Study of the orbital mechanics of the solar system in the 1970s led Russians to believe the Earth was about to cool and we should prepare quickly because it will be catastrophic. Their arguments were lost in the rush to warming group-think in the 1990s, but the arguments for impending cold are well founded and still believed by many good scientists. As the sun goes even quieter and January, 2008 saw the greatest year to year temperature drop ever (128 years of NASA GISS data) and thru the end of 2008 remains relatively cool, it is clear cooling needs to be considered as a very plausible future. This is highlighted by 2 papers published in March 2008. Scafetta and West showed that up to 69% of observed warming is from the sun and remind us that the sun is projected to cool and Ramanathan and Carmichael show that soot has 60% of the warming power of CO2. Both papers state that these factors are underappreciated by IPCC. The soot may well explain the Arctic melting, as it has recently for Asian glaciers. Many scientists believe the temperature changes are more dependent on the sun than CO2, similar to the relationship in your home with your furnace. With the Sun's face nearly quiet, the monthly patterns over the last 12 months are most similar to those of 1797 preceding the Dalton Minimum of 1798-1823 during the little ice age (Timo Niroma).
The southern hemisphere
has been cooling over the last 10 years, just about as much as the north
has been warming. There is no proof within observational data of warming
outside of natural variation. When
3 of the highest 5 or 6 years in the temperature record (since 1890) occurred
over 70 years ago and 1900 was warmer than recent years in the USA (where
the best data are), we are nowhere near statistical proof, nor even evidence
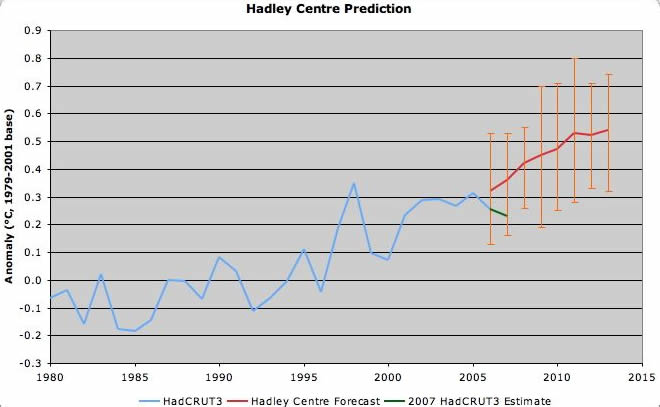
of warming. Modelers are still unable to include important variables and
no one is able to predict the future. At least Hadley Centre have tried
(below). While CO2 continues to rise, the temperature has stabilized at
a warm level, but not unusually so. Which way will it go? The world seems
to be betting on warming. However, the probability of cooling may be equally
valid and we
must be prepared for both. Cooling presents the real danger. Things
that go up and down only go so high. It has always been this way. Image
of current northern sea ice (latest). Check
the S.
hemisphere sea ice (latest).
When
3 of the highest 5 or 6 years in the temperature record (since 1890) occurred
over 70 years ago and 1900 was warmer than recent years in the USA (where
the best data are), we are nowhere near statistical proof, nor even evidence
of warming. Modelers are still unable to include important variables and
no one is able to predict the future. At least Hadley Centre have tried
(below). While CO2 continues to rise, the temperature has stabilized at
a warm level, but not unusually so. Which way will it go? The world seems
to be betting on warming. However, the probability of cooling may be equally
valid and we
must be prepared for both. Cooling presents the real danger. Things
that go up and down only go so high. It has always been this way. Image
of current northern sea ice (latest). Check
the S.
hemisphere sea ice (latest).
Virtually all scientists agree
that the Earth has warmed a small amount since the year 1000 or, if you
choose, since 1850, when instrumented temperature records became reasonably
accurate and distributed in key areas of the world. An alternative view,
is that the Earth has been cooling since the 1930s when we had 3 of the
5 warmest years
since 1860 in the US, and probably globally if the world environmental
data base were cleaned up as is happening in the US. This site will be
developed to show the science and the impacts related to global cooling,
a very scary event compared to warming. It corresponds in the opposite
way to the thousands of global warming sites. An
unbiased view is at our sister-site: Climate Change Facts. The Editor
started his interest in climate change in the 1970s, charged with helping
industry adapt to the certainty of global cooling. Tim
Ball has documented the cooling trend and its implications.
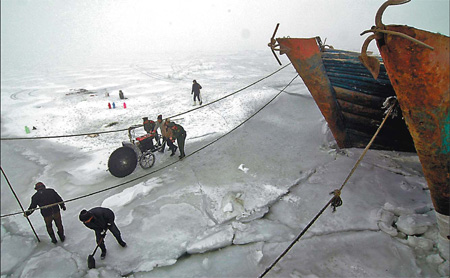
Ice creates chaos in China (Winter 2010)
Heavy snow and unusually cold weather have swept across most parts of China this winter, causing travel chaos on roads and on the sea, with forecasters predicting worse to come. Huludao is facing the worst sea ice in three decades and the sea froze a month earlier than usual.
"The sea ice is about 60 nautical miles (110 km) off the coast of Liaodong Bay," Liu Yu, the station's chief forecaster reported.
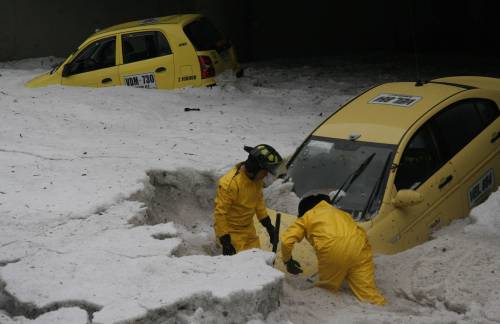
Photo: Snow and ice in Bogota (Click) Spanish
And record cold in Buenos Aires - but "it can't be blamed on Global Warming"!! (Click) Spanish
There are still many solid scientists who think that the amount of warming is so small that it is indistinguishable from the noise in the environment data sets, and that the data have not been properly adjusted for such things as urban heat island effects, and instrument calibration. This is particularly true of the global data set, even though "urbanization has caused regional increases in temperature that exceed those measured on a global scale, leading to urban heat islands as much as 12°C hotter than their surroundings". Also, it is generally accepted that the Earth has been much wa
rmer than today, for example, in the time of the dinosaurs (the mid-cretaceous period) when the CO2 was 2 to 4 times greater than today (NOAA). More recently, in the prior period between ice ages, just 125,000 years ago, the Earth also was much warmer than today and the sea level much higher - by about 13 to 20 feet (4 to 6 meters) (IPCC). The primary driver of the past climate shifts is believed to be orbital mechanics and solar variability, with some contribution from Earth geophysical processes, such as volcanic eruptions. It is also known that mankind's contribution to CO2 is just a small percent of the total amount. The Earth's ability to absorb CO2 has apparently been underestimated and the climate models need revision per the 31 December 2009 publication of work by Wolfgang Knorr that shows "No Rise of Atmospheric Carbon Dioxide Fraction in Past 160 Years" (a seminal study). Lastly,, we know that the Earth's temperature and the level of CO2 rise and fall roughly together, but it is not clear (not proven) whether this is cause and effect by either variable. In a first attempt to use a CO2 - based model to predict temperatures, the results are not impressive at all and are exactly opposite observations.
Despite what the newspapers say, the cause of the temperature rise, and therefore the future course, is settled only within the consensus group of scientists. This is based on work of computer modelers, believing their increasingly complex models show the cause is due to man's activities and that there will be increasing temperatures according to how much additional greenhouse gases are emitted. TScience News: Chilling Possibilitieshere are many other scientists who are non-modelers, many with backgrounds as atmospheric physicists, climatologists, engineers, meteorologists, and paleo-climatologists, who do not believe the primary cause is mankind, although this could be part of it. Most of these scientists believe that the sun is at the root of the warming (if any), but that other factors are also at work. To help separate fact from fiction, an explanation of these thoughts is included here, along with links to these materials.
The chart below is from the Climatic Research Unit (CRU) at the University of East Anglia, which is well respected for its historical databases maintained at the global level, and which are used in IPCC assessments. See the chart for 1860 to present by month, year and quarter by hemisphere. Note that "global" warming is greatest in the Northern hemisphere. Links to similar charts, Hadley composite charts but all slightly different with different assumptions or algorithms to fill in missing or sparse data, are provided in the left margin below. The Japan Met. Agency (JMA) site is recommended because it is interactive and allows you to query the data base. For example, go to the JMA site and try different months, such as August and September. This will confirm the IPCC models that predict more warming will occur during the winter months than the summer. We don't know if this true.
This chart looks ominous until put into the context that
the average temperature for 1901-2000 is 13.9C (57.0F), so we are talking
about a change from about
13.5 to 14.3 C or 56.3 to 57. 7 F. Scientifically, we should use absolute
temperatures, which would add an additional 273 C (460 F) degrees. In this
context the increase is about 0.3 % Note on the chart that this premier data
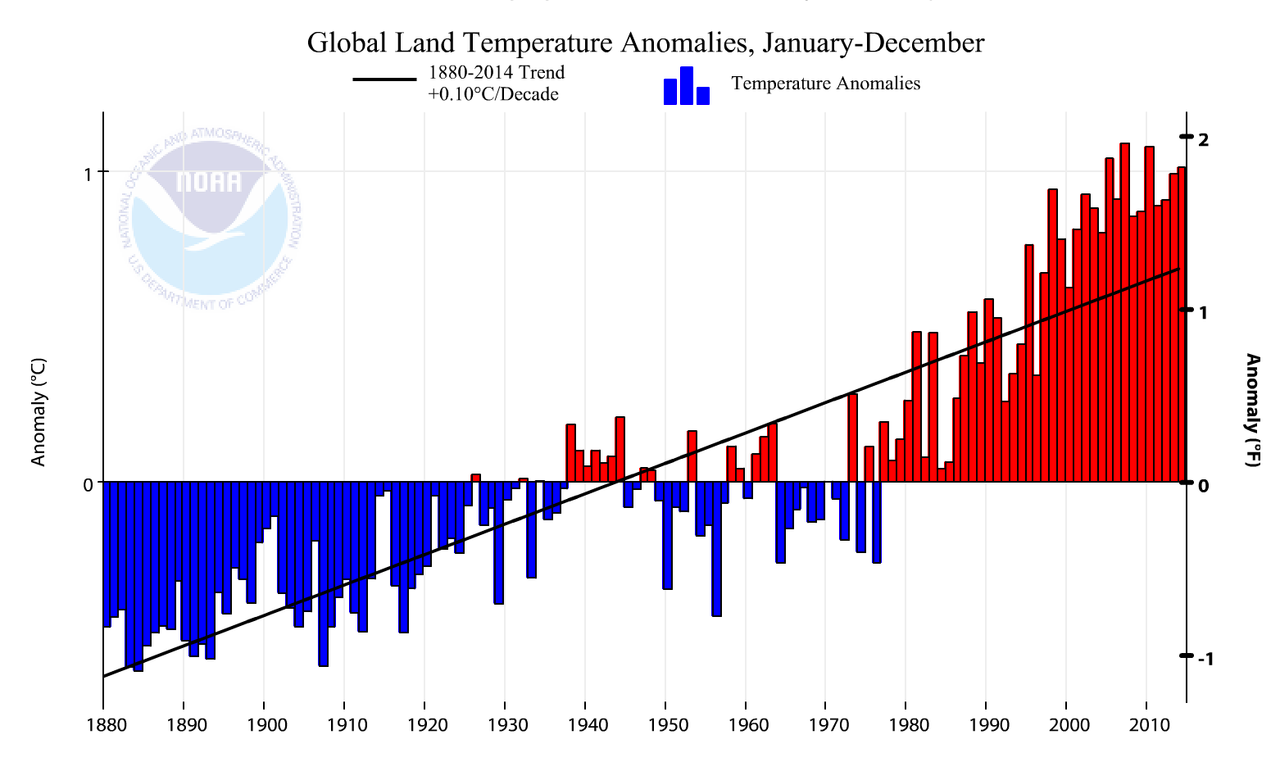 set puts the observed global warming at 0.42 deg. C (0.8 deg F) above the
mean. As seen below, this increase since the mid 1800s is similar to that
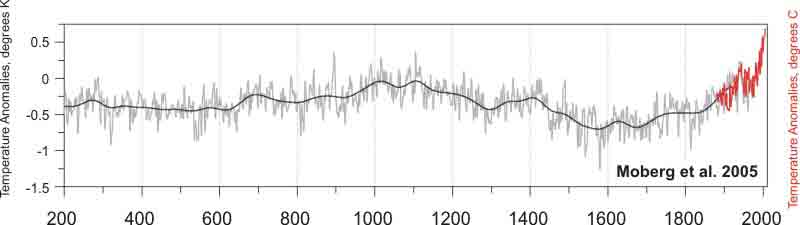
since the year 1000, although IPCC says the present temperature is likely higher.
Greenland ice cores indicate that the start of the instrumented data (thermometers)
coincides with a cold period in the northern hemisphere and that at the
site
of a well-studied ice core (Global Cooling-Doomsday Called Off), the
temperature in the mid 1800s was the coldest in 8,000 years.
set puts the observed global warming at 0.42 deg. C (0.8 deg F) above the
mean. As seen below, this increase since the mid 1800s is similar to that
since the year 1000, although IPCC says the present temperature is likely higher.
Greenland ice cores indicate that the start of the instrumented data (thermometers)
coincides with a cold period in the northern hemisphere and that at the
site
of a well-studied ice core (Global Cooling-Doomsday Called Off), the
temperature in the mid 1800s was the coldest in 8,000 years.
The Global Data are a Mess.
For the
USA, the
trend is less pronounced. Three of the 5 warmest years occurred about 80
years ago and 1900 was warmer than many recent years.
NOAA/NCDC revised
data on May 1, 2007 and NASA did so in August 2007. Per
NOAA: This new data set uses mostly rural data and algorithms are
used to identify and correct extraneous factors such as urban heat island
effects. NOAA: "U.S.
and global an nual temperatures are now approximately 1.0°F warmer than
at the start of the 20th century, and the rate of warming has accelerated
over the past 30 years, increasing globally since the mid-1970's at a
rate approximately three times faster than the century-scale trend. However,
we are still cooler
than in the 1930s and several recent years are below 1900. Comment: The
use of this new NOAA data set has dropped the temperature increase to
1.0 deg. F (.56 C) from the "improved
data set of 2005" which had yielded a rise of 1.12 F. NOAA
also says: The global annual temperature for combined land and ocean
surfaces in 2006 was +0.54°C (+0.97°F) above average. But in the most
recent data NOAA
NCDC: "For the contiguous
United States, the average temperature for October was 54.5°F (12.5°C),
which was 0.3°F (0.2°C) below the 20th century mean, and ranked as the
44th coolest October on record, based on preliminary data." The NASA
GISS chart of US
data is shown. Our view:
nual temperatures are now approximately 1.0°F warmer than
at the start of the 20th century, and the rate of warming has accelerated
over the past 30 years, increasing globally since the mid-1970's at a
rate approximately three times faster than the century-scale trend. However,
we are still cooler
than in the 1930s and several recent years are below 1900. Comment: The
use of this new NOAA data set has dropped the temperature increase to
1.0 deg. F (.56 C) from the "improved
data set of 2005" which had yielded a rise of 1.12 F. NOAA
also says: The global annual temperature for combined land and ocean
surfaces in 2006 was +0.54°C (+0.97°F) above average. But in the most
recent data NOAA
NCDC: "For the contiguous
United States, the average temperature for October was 54.5°F (12.5°C),
which was 0.3°F (0.2°C) below the 20th century mean, and ranked as the
44th coolest October on record, based on preliminary data." The NASA
GISS chart of US
data is shown. Our view: 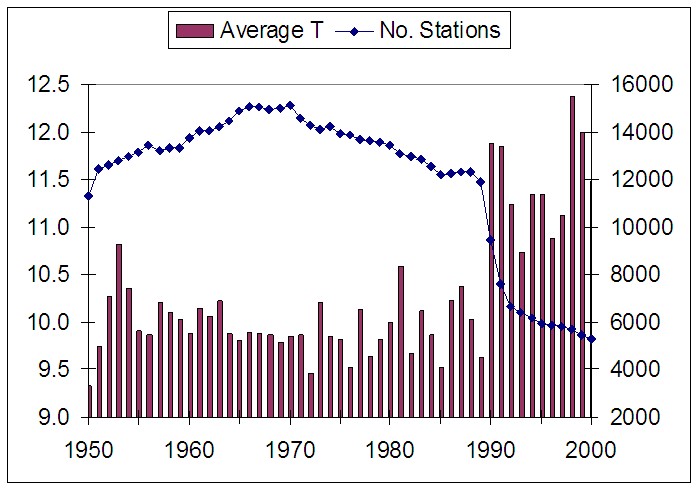 It
is not clear this is worth getting excited about, given that the benefits
of warming likely exceed the detriments and that this rise may be a data
artifact, or a mostly natural variation. We believe if the global data
set were given equal scrutiny to the US set, global warming would either
vanish or be barely detectable. Russian
Academicians believe
major cooling is imminent. The January
2009 PRAVDA ice-age article is
likely vetted by them and the IPCC co-chair.
It
is not clear this is worth getting excited about, given that the benefits
of warming likely exceed the detriments and that this rise may be a data
artifact, or a mostly natural variation. We believe if the global data
set were given equal scrutiny to the US set, global warming would either
vanish or be barely detectable. Russian
Academicians believe
major cooling is imminent. The January
2009 PRAVDA ice-age article is
likely vetted by them and the IPCC co-chair.
As the number of stations (often rural) has fallen the temperature has risen in an inverse relationship, suggesting the Urban Heat Island effect is the key component of any rise.
Global Warming?: Time for a Reality Check?
In the prior inter-glacial period about 125,000 years ago, there was no summer ice at the North Pole and the sea level was 15 feet (5m) higher than today. Is this going to happen anyway? Is our temperature just naturally rising and if our own CO2 is helping it along, won't temperature still rise, even when we stop breathing?
IPCC 2007 reports the prior inter-glacial warmth was driven by orbital mechanics that are not present today. Nevertheless, this prior warmth tells us much about what the true impacts will likely be because nearly all the plant and animal species on Earth now were present then also.
Resource alarmists believe we will soon run out of fossil fuels. As soon as this happens, it seems, prices will rise and the CO2 problem will simply go away as plants clear out the CO2, that seems to be getting ahead of their ability to remove it. For reason to prevail, as depicted in the GCMs (Global Circulation (or Climate) Models), somebody must know of magnificent petroleum reserves hidden from the prophets of doom. Different parts of certain NGOs (Non Governmental Organizations) ought to get together to get their story straight. If we were to take the IPCC approach, we would look at the literature and note the range of projections and include all these impacts. Doing so would show that the US Energy Information Agency seems alone in showing a growth in oil and gas production for 20 years (limit of projection), driven by increased prices as demand outstrips supply. This is not unreasonable. Other energy advisors in the private sector see a 25% drop in production in about the same period. The projection to the end of the century ranges from sharp reductions to zero output of oil and gas. The reserves of coal are much greater and production will peak later, but soon, within 10 years being often proposed. For most coal producing countries, coal output is in steady decline. Shortages will drive prices making recovery of presently marginal sources and types of fossil fuels feasible. But, it is all a matter of time before CO2 production from all fossil sources declines. The upheaval to society will likely surpass even the most extreme visions of global warming impacts. In March 2008, the price of coal had risen 50% over sixmonths, and the upheavel was documented by the Washington Post. The Earth's ability to absorb CO2 has apparently been underestimated and the climate models need revision per the 31 December 2009 validation of work by Wolfgang Knorr that shows "No Rise of Atmospheric Carbon Dioxide Fraction in Past 160 Years".
The IPCC 2007 Climate Forecast for this Century:
- CO2 (the most important gas) has risen from 280 ppm to 379 since pre-industrial times and its growth seems to be accelerating. Whether it does or not is the basis for 7 assumptions about future temperatures.
- Temperature increase. For the next 2 decades, 0.2 deg. C (0.4 F) temperature rise per decade, slightly higher later in most models. The models are all different and respond differently to different assumptions. For the end of this century, IPCC provides 7 best estimates (for 7 assumptions) ranging from 0.6 - 4.0 C (1.1-7.2 F). Warming is likely to lie in the range 2-4.5 deg. C (3.6-8.1 F), with a most likely value of about 3 deg. C (5.4 F). Since the 1800s the temperature has risen 0.76 deg.C (1.4 F). The warming is to be greater on land, in high northern latitudes.
- Sea level rise. For 6 sets of assumptions, the mid-points are about 0.3 meters ( 1 ft.) Since 1850 sea level has risen about 200 mm (9 in.), a little less than 2 mm/yr. More recently the rate appears to be 3.1 mm/yr, now measured by altimetry satellites. (However, we learned on 22 June 2007 that the data were manipulated to achieve this!!). In a 2009-published study, the authors used GPS measurement to correct for local vertical movement of the Earth at key tide gages, finding a "global rate of geocentric sea level rise of 1.61 ± 0.19mm/yr over the past century" with no acceleration.
- Other attributes. Ocean acidity should rise with reduced ph units of 0.14 to 0.35; hurricanes become more intense, perhaps less numerous; heat waves and heavy precipitation more frequent; less sea ice and snow cover; higher westerly winds in mid-latitudes; more precipitation in high latitudes, less in sub-tropics inland areas.
Impact Assessments Require Trust in the Climate Forecast
My specialty is in impacts assessment (oceans, coasts, fisheries, polar regions), not the science of climate change. However, to determine impacts correctly, one must understand the nature of change and its likelihood to continue. It is necessary to have trust in what the climate scientists tell you is going to happen in the future. In the IPCC structure, the science has been led by the UK and US scientists, and they have used modeling as their primary tool, with some paleoclimate analysis coming later. The Impact Assessments have been led by the Russians, who have had an intense distrust of modeling. They viewed paleoclimatology as the most valid tool: if you want to know what will happen when CO2 rises or the temperature changes, they say to look at the history of the earth. As an American, working with the Russian teams, I was often caught in the middle of both camps. I learned to listen to both views, and continue to do so. In particular, we learned to distrust any science literature or impacts assessment that did not consider all data available, whether modeling, the instrumented record back into the 1800s and/or the paleo and historical temperature reconstructions. If the data are truncated, there is likely an agenda. Many of us have learned, either formally, or informally, how to detect misrepresentation by statistical treatments and graphics.
How To Tell If an Impact Assessment Is Biased
When reviewing impact assessments, look for bias. Often the authors think only of negative changes. This is not necessarily because of personal agendas (such as to assist animals, clean the air, or reduce the birth rate), but is primarily due to human nature. To guard against having a biased report, one should look for balance. Does the material articulate that things will be different and that there are pluses and minuses? There may well be more of one than another. Sometimes balance is reflected in the amount of text, or graphics made to illustrate impacts and often it is reflected in the number of negative versus positive impacts, the latter often left out completely at the first draft stage. If missing, they tend to be only partially treated thereafter as the authors slowly yield to reviewer comments. Examples of balance:
- Discussions of increased summer heat waves and deaths should also include the reductions of winter cold waves and hypothermia deaths.
- Increased costs of home air conditioning need to be discussed in the same context as reduced heating costs.
- Increased mismatches between food availability in ecosystems need to also include reduced energy demands needed to maintain body temperature, such as for marine mammals and the fact that plants and cold-blooded animals usually grow faster when warmer rather than colder. Thus the food of most fish and mammals grows faster when warmer.
- Discussions of coral reef bleaching need to include the expansion of coral reef habitats.
- Discussions of agriculture and forestry problems such as regional droughts and changing types of plants must include the expansion of production areas, general increased precipitation, and CO2 fertilization.
- Discussions of poison ivy becoming more prolific because of wetter environments, warmer temperatures, and CO2 fertilization, should similarly treat agricultural crops and forests.
- Discussions of polar bear food contraints must include the impact on the seals and other items they kill.
The IPCC Projections do not Comport with Reality
- CO2 has usually been associated with temperature rise throughout the history of the Earth. It is indeed a greenhouse gas but it operates on a logarithmic function. The Earth's natural processes also contribute, and remove, copious amounts of CO2. Since plants first appeared on the Earth, they have converted nearly all available CO2 to oxygen, fossil fuels, and other longterm removals from the atmosphere. Today less than 4/100 of 1% (379 ppm) of our atmosphere is CO2. This pales in comparison with other periods in Earth's history. Common IPCC scenarios rely on an increasing supply of fossil fuels, yet we know that this is not possible and that production will soon peak (if not already) while prices will continue to rise. It is absolutely unrealistic to think CO2 emissions will rise for the duration of this century.
- The projected temperature rise is unrealistic, given that the USA and global temperatures have risen by only 1 deg F (.5 C) in 100 years (revised, NOAA, 1 May 2007 ), (or 150 years using the full instrumented data set) during the height of industrial expansion. Even if all this rise is correct, and is attributable to human causes, it is a trivial amount in the natural variation of the Earth, and to suggest the rise would accelerate 5 fold (IPCC best estimate) in this century is incredible. Even after the release of the new data set and procedures by NOAA on May 1, which addressed some of the urban heat island issues and dropped the warming 44% (below IPCC 2007), significant other urban heat island issues still remain. There are also issues of calibration as measurement protocols have changed, issues about the design and placement of the temperature stations, and even the strongly held view by many skeptics that this is a natural rise as the Earth recovers from the Little Ice Age (circa 1500-1900).
- Sea level rise may have increased recently, but other studies have consistently shown no increase. Even if there is an increase, it is in the order of 1 mm per year on top of the 1-2 mm per year that has been happening for the last century, this additional amount is 4 inches (10 cm) over the century. This is not trivial if you are in a low-lying region wrestling with land subsidence, but it is barely more than what would be coming anyway.
- The other forecasts, such as for hurricanes, rainfall, and snow cover, are not significantly different than under natural variability, and will advance more slowly than the decadal oscillations. In particular, if ocean acidity were a problem for shell formation, it would have shown up already in areas where there are naturally high levels of CO2. It has not. Further, the lead hurricane expert for IPCC, Chris Landsea, resigned over the misrepresentation of data by IPCC
The Present and Projected Increases are Not Huge
Oceans and coastal zones, the things I know best, have been far warmer and colder than is projected in the present scenarios of climate change. Marine life has been in the oceans nearly since when they were formed. During the millennia they endured and responded to CO2 levels well beyond anything projected. Prior temperature changes put tropical plants and coral reefs near the poles or had much of our land covered by ice more than a mile thick. The memory of these events is built into the genetic plasticity of the species on this planet. IPCC forecasts are for warming to occur faster than evolution is considered to occur, so impacts will be determined by this plasticity and the resiliency of affected organisms to find suitable habitats. Species mixes and distributions will change, just as they always have. Some species will be so disadvantaged they will go extinct and ecological niches will develop that offer opportunities for new species to arise.
The chart is of the Paleo Record. Northern Hemisphere Annual Temperatures from Low- and High-Resolution Proxy Data over the last 2000 Years. The red signifies only the use of the instrumented record, since about 1860.(From NOAA/NCDC).
In the oceans, major climate warming
and cooling is a fact of life, whether it is over a few years as in an
El Niño or over decades as in the Pacific Decadal Oscillation or the
North Atlantic Oscillation. Currents, temperatures, salinity, and biology
change rapidly to the new state in months or a couple years. These changes
far exceed the changes expected with global warming and occur much faster.
The one degree F. rise since about 1860, indeed since the year 1000,
has brought the global average temperature from 56.6 to 57.4 degrees F
(13.5 to 14.3 C). This is at the level of noise in this rapidly changing
system.
Sea level has been inexorably rising since the last glaciation lost its grip,
and temperatures rose by 10-20 degrees, a mere 10,000 years ago. It is
only some few thousand years since Georges Bank was part of the mainland.
It is now 60 miles offshore of Provincetown on Cape Cod. Its trees and
the shells of its oysters that flourished on its shores still come up in
dredges and trawls in now deep water, with the oysters looking like they
were shucked yesterday. In the face of all these natural changes, and those
we are here to consider, some species flourish while others diminish. These
considerations were well 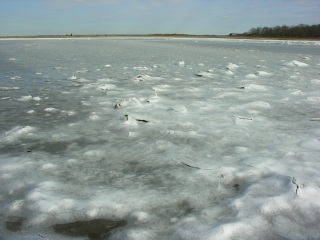 understood
in all the IPCC groups in which I participated.
I have some concerns about some few species near the margins of their suitable
habitat range. These include corals near the equator and perhaps polar
bears. But I would much rather have the present warm climate, and even
with the IPCC’s warming, than the next ice age that will likely last
over 100,000 years and bring temperatures much colder than even today.
The NOAA PaleoClimate Program shows us that when the dinosaurs roamed the earth,
the earth was much warmer, the CO2 levels were 2 to 4 times higher, and
coral reefs were much more expansive. The earth was so productive then
that we are still using the oil, coal, and gas it generated. In contrast,
the last ice age maximum, at just 20,000 years ago saw temperatures 4-7
deg. C (7.6-13.6 F) cooler than present. The one deg. F rise since the
1850s is a relatively small component. (Photo of frozen North Cove, Fairhaven
Mass. in March 2007; courtesy of OceansArt.us).
understood
in all the IPCC groups in which I participated.
I have some concerns about some few species near the margins of their suitable
habitat range. These include corals near the equator and perhaps polar
bears. But I would much rather have the present warm climate, and even
with the IPCC’s warming, than the next ice age that will likely last
over 100,000 years and bring temperatures much colder than even today.
The NOAA PaleoClimate Program shows us that when the dinosaurs roamed the earth,
the earth was much warmer, the CO2 levels were 2 to 4 times higher, and
coral reefs were much more expansive. The earth was so productive then
that we are still using the oil, coal, and gas it generated. In contrast,
the last ice age maximum, at just 20,000 years ago saw temperatures 4-7
deg. C (7.6-13.6 F) cooler than present. The one deg. F rise since the
1850s is a relatively small component. (Photo of frozen North Cove, Fairhaven
Mass. in March 2007; courtesy of OceansArt.us).
Was the Earth Warmer Before? Sea Level Higher? CO2 Higher?
There are many frequently asked questions (FAQs), some of which are addressed here.
IPCC: Global average sea level in the last interglacial (Eemian) period
(130,000-111,000 years ago) was likely 13 to 20 feet (4 to 6 meters) higher
than during the 20th century, mainly due to the retreat of polar ice. Ice
core data indicate that average Arctic temperatures at that time were 5.7
to 9.5 deg. F (3 to 5 deg. C) higher than present, because of differences
in the Earth’s orbit. The Greenland ice sheet and other Arctic ice fields
likely contributed no more than 13 feet (4 meters) of the observed sea
level rise. There may also 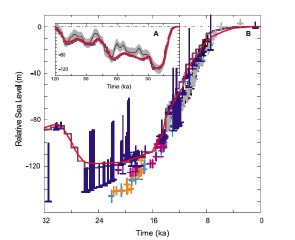 have
been a contribution from Antarctica. Note in the chart how the rate of
sea level rise is very low compared to that when the ice age wanes. (Chart/text
IPCC 2007).
have
been a contribution from Antarctica. Note in the chart how the rate of
sea level rise is very low compared to that when the ice age wanes. (Chart/text
IPCC 2007).
NOAA: The Mid-Cretaceous period is one period in the geologic past that
stands out as distinctly warmer than today, particularly at high latitudes.
During the mid-Cretaceous Period, 120-90 million years ago, fossil
remains of plants and animals believed to inhabit warm environments,
were found at much higher latitudes. Breadfruit trees apparently grew
as far north as Greenland (55° N), and in the oceans, warm water corals
grew farther away from the equator in both hemispheres....... The mid-Cretaceous
was characterized by geography and an ocean circulation that was vastly
different from today; as well as higher carbon dioxide levels (at least
2 to 4 times higher than today). This indicates that the mid-Cretaceous
climate system was different from that of today or any we might have
in the future. Explanations evoking ocean and atmospheric circulation
patterns radically different from today have been proposed to explain
the climate of the mid-Cretaceous; however, there is no scientific
consensus on how the Mid-Cretaceous warm climate came about (source: NOAA
Paleo Climatology program). In some ancient times when CO2 levels were
very high, ocean organisms with shells based on silica replaced those with
shells based on calcium.
During the Mid-Pliocene (about 3 million years ago) global temperatures were substantially warmer for a sustained period and are similar to those forecast by IPCC, with similar CO2 and sea levels of 15-25 meters (50-82 ft.) greater than today. Most of the warming was in the high northern latitudes with little warming in the tropics. Even just 7 thousand years ago, in the midst of the present period (Holocene) between glaciation, the Russian Arctic, at least, was 2.5-7 deg.C (4-12 F) warmer than today (Quartenary Research).
Dr. Nils-Axel Mörner (leading expert on sea level): "If you go around the globe, you find no rise anywhere. But they need the rise, because if there is no rise, there is no death threat. They say there is nothing good to come from a sea-level rise, only problems, coastal problems. If you have a temperature rise, if it’s a problem in one area, it’s beneficial in another area. But sea level is the real “bad guy,” and therefore they have talked very much about it. But the real thing is, that it doesn’t exist in observational data, only in computer modeling." Dr. Mörner's credentials. In a 2009 study, using GPS measurements to correct for local vertical movement of the Earth at key tide gages, finding a "global rate of geocentric sea level rise of 1.61 ± 0.19mm/yr over the past century". Their study shows no acceleration and no changes in rate during warm or cold periods of the last 110 years. It is virtually a straight-line rate of increase, independent of Earth's temperature.
What Actions Should We Take to Respond to Climate Change?
We should respond prudently to the threats from climate change. These
actions should include things that make sense in their own right and which
will be important whether the Earth warms or cools in the near future.
In the distant future it is a certainty that the Earth will warm beyond
what we have today and that the next ice age is waiting in the wings, but
not for another 30,000 years or so, according to our present knowledge
of solar variability and orbital mechanics (IPCC 2007). If we are concerned
about global warming, a guiding principle is to do things that yield
a cost savings or are neutral. Overall, we should aim to reduce our cost
of goods sold and, at the consumer level, our living expenses, while at
the same time "cleaning
up our act".
What should we do now? See Ways
to Improve Energy Efficiency and Energy Sources. We also have a mixture
of half serious and tongue-in-cheek
ideas to halt climate change.) All of us should lead
by example, and as much as possible, within the market place,
while keeping our personal freedoms we hold so dear. One way to check?
Look at your household energy consumption. It is reasonable to have it
drop one percent every two years for as long as you have been in your
house, just from household maintenance, appliance replacement and replacing
light bulbs with fluorescents or LEDs when they burn out. All lights
on timers, for example, should be fluorescents (See cflsafety.blogspot.com for
a review of safety concerns). Do we adjust the thermostat for when nobody is
home? Is our shower just a little too long? Perhaps the biggest example would
be in not begetting more children than is socially responsible.
See our list of ways to
secure energy sources, improve efficiency and alternative energies.
What Actions Should We Not Take to Respond to Climate Change?
We must respond prudently to the threats from climate change. We live in a global economy, much of it with lower production costs than our own in the developed world. Whether we live in the USA, Japan, Australia, New Zealand or the EU, we know our job losses are draining our countries, making it more difficult to support our retirement programs, health benefits, and even our national defense. We must be careful to not further increase the costs of our products and services. So we --
- Should not commit to actions that put us at a disadvantage, whether it is the Kyoto protocol or some other vehicle Increase our taxes on fuels (e.g., a carbon tax) that are inputs to production and services. If a taxing regime is implemented it must separate production uses from consumption.
- Should not forget that the most valuable things we have are our health, our lives, and our family, and place them at risk by driving, or riding in, vehicles that put them at risk in order to save energy or other costs. If there are larger vehicles where you drive, don't get priorities confused.
- Should not stop breathing even though it would be one of the most immediate steps to slow CO2 emissions.
- Should not do things without thinking. There are many ideas that may not have merit. For example, buying local vegetables to reduce transportation costs may actually increase energy use if the far off producer is a more efficient, and this is likely, if its costs are lower even after getting its goods to the local market. Another example is in using biofuels that have a high fossil energy input in fertilizer or machinery, or planting trees to reduce CO2, but finding out they also absorb solar radiation more than what they replace.
What Issues Separate the Consensus and Skeptic Scientists?
There are four elements separating consensus and skeptic scientists. Not all elements are disputed by everyone. The elements are: (1) the amount of temperature change since 1850; (2) whether the change is in the range of natural variability or is attributable to humans; (3) the amount of warming that greenhouse gases (CO2 and equivalents) will warm the Earth in the future; and whether for the most likely scenarios, there are more losers than winners and if the change is just different. Underlying these elements are several issues:
- Reliance on Computer Models. The sophistication of computer models has advanced steadily over the past few years, to the point that many scientists believe the models are able to forecast future changes in climate. Other scientists believe that the outputs, while interesting, do not match the reality of what happened in prior periods of the Earth's history when the temperature was higher and the CO2 levels 2 to 20 times higher than today. Most also believe the Earth system is far too complex, with too many unknown drivers and feedbacks, to enable use of models. One example is the El Niño phenomenon, which is not reliably modeled after decades of study. Another is that there are indications that the models are wrong in the drought predictions in the tropics and subtropics. Paleo data shows that deserts were wetter during prior warm periods and a May, 2007 paper in Nature points out that there is a ~6.5% rise in precip per deg C, while the models only use 1-3%, an error of 3X! in results. This explains better the satellite obs of a greener, wetter Earth (NASA). The models cannot be initialized to current conditions and are unable to correctly incorporate the major decadal scale vents such as the NAO and the PDO, that control our climate in the northern hemisphere (Dr. Kevin Trenberth, IPCC Author).
- Computer models are too coarse. Everyone knows the models should have finer resolution, but there are computational constraints and staffing constraints to develop models at the regional or even local scale. The skeptics argue that this is part of the overstating of impacts. for example. a mountainous area the size of a large country may have an average height that is barely above sea level. The rain-producing mountains that intercept sea-breezes do not exist in the model and the result of the simulation understates future rainfall for the region. There is also a problem in the use of average temperatures in that they do not capture the difference in density and humidity.
- The models do not seem correct. The warming of the ocean, the warming of the land, the rise of sea level are all coming in below projections, while much more rain is falling, as the time series grows and even as the models are "adjusted" to reflect the observations, casting their basic premises into doubt. On 22 June, 2007 (Dr. Nils-Axel Mörner) we learned that data were manipulated to create an acceleration in sea level rise. Warming should be detected through an acceleration in the rate of rise and that rise should slow the Earth's rotation. Neither has occurred.
- Attribution of the warming trend to human activities. The consensus scientists believe their models can replicate reasonably enough the contribution of human-caused greenhouse gases and thus they can be used to estimate future warming. The other scientists believe this is not the case. The reasons vary among the scientists, but the most common ones are: CO2, the target gas, pales in its abilities to impact temperature compared to water vapor and solar variability (not just radiation but also magnetic flux (which controls cosmic radiation and cloudiness) and orbital mechanics). Some scientists believe that CO2 is actually a cooling gas and we need to look elsewhere. Additional factors that some skeptics believe are not adequately considered are the natural contributions of CO2 and other gases that dwarf the human component and the impact of cosmic radiation on the formation of clouds. Also, it is not clear to some scientists whether CO2 increases lead to warming or whether warming leads to CO2 increases. To many skeptics, the over valuation of CO2 as a causative agent, particularly in light of it having a logarithmic function that decreases impact with the amount of CO2, is an indication of a policy agenda meant to deter the use of fossil fuels, not understand climate change.
- This warming may be natural variability. While most scientists believe that the observed warming is real, some believe that it is so slight that we can't be sure that instrument calibration problems and urban heat island impacts have been dealt with adequately. If not, it has not been for lack of effort. The problems are immense. For example, in 1999, Los Angeles moved its data station 4 miles to an area outside the city that is lower in elevation and nearer the coast, with cooler, drier, and less extreme conditions. Even when a location has not moved, the rising temperatures may reflect the growth of a community, or land use changes, around it. Calibration is daunting for calibrating the instruments themselves. An example is relating sea surface temperatures that were derived from a thermometer placed in a bucket of water pulled from the ocean in 1860, with a continuous stream of data taken from a ship's water inlet much deeper in the water in the 1960s, data from drifting and moored buoys transmitted by satellite in the 1980s, and with satellite data from the very top layer of the surface since the 1970s. Perhaps only time will really tell. Many skeptic scientists believe that the trend line turned in 1998 for the present cycle, while many consensus scientists are quick to point out that we are still having temperatures above average, and in turn, the skeptics claim that there is no real way to compute a global average. Lastly, the best data are from the USA. According to NOAA, 2006 was the warmest year in U.S. records, almost the same as 1936. The skeptics say that if only rural sites are used, the temperature actually falls, indicating that in the US, and probably the world, what has been measured is the growth of cities and the heat they absorb and generate; there is no warming.
- This warming is largely recovery from the Little Ice Age. The natural rate of increase of about 1 deg F (0.5 C) since the LIA (~1500-1900) has not been removed from the IPCC estimations of temperature rise. The CO2 contribution is negligible or non-existent because there is no credible way to compensate for the sharp cooling from 1940 to the 1970s in the face of the rapid growth of CO2, nor the similar (to present) rise from 1920 to 1940 in the absence of rapid CO2 growth. See for example, Is the Earth still recovering from the “Little Ice Age”?: A possible cause of global warming by Syun-Ichi Akasofu (7 May 2007) . Another difficulty with accepting the temperature rise at face value is the evidence that the start of the use of thermometers in about 1850 comes at the same time as the emergence from the coldest period in 8,000 years.
- The rate of warming is dangerous. Not so, say the skeptics, pointing out that the rate of warming from 1980 to 1998 has been seen before, and for many parts of the Earth such temperature changes are recurrent, such as when the Atlantic and Pacific and ENSO (el Niño) oscillations change state, causing immediate massive changes in ocean environments of fish, corals, and marine mammals.
- Sensationalist press not counteracted. The fact that Antarctica is warming in the area nearest Chile gets heralded, but the IPCC science documents show that, as a whole, Antarctica is stable. Flooding of coasts and cities, attributed to warming, is not countered by the IPCC, even though its science document shows no discernible acceleration in the rate of rise, a solid indicator of warming and necessary for prior sea level projections.
- Warming Impacts. Many scientists in the consensus group believe that the IPCC estimates of temperature rise are accurate and the impact from these changes will be bad for the Earth, its ecosystems, and its people. Other scientists, even if accepting the IPCC forecasts, believe that the Earth was warmer before and with higher CO2 levels and that these were among the most ecologically productive periods in terms of speciation and biomass. This contrasts sharply with periods of glaciation, the ice ages, that come and go whether humans have any influence or not. A case in point is my testimony which shows the paleo record tells us that corals were very expansive when the Earth was warmer and CO2 much higher, whereas 3 other scientists testified that corals were in grave danger, even now, due to the high temperatures and acidification of the ocean caused by CO2.
- An Average Wrong Answer. The IPCC reliance on emission scenarios, and then presenting all the outputs of temperature rise and impacts as if they had somewhat equal probability, leads to an average wrong answer and exaggerated impact assessments.
- Influence of the Sun. Scientists affiliated with
the Consensus believe solar influences are not important to the recent
warming and that are actually in the wrong direction (See
recent paper by Lockwood and Frohlich). Other
scientists believe that the analysis is flawed and that the actual
mechanisms through which the Sun affects Earth climate were not
used in the analysis (for
example, Whitehouse). Solar mechanisms, not used in climate models,
include several cycles of a few to hundreds of years. When superimposed,
they have profound warming or cooling effects. MAny solar scientists
believe that most of the Earth's temperature variation is explained
by the sun's activity and our proximity to it (Scafetta
and West).
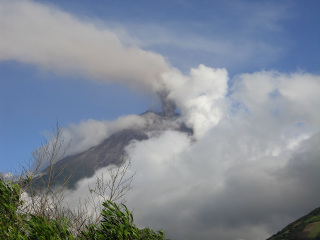
These issues and many more are hotly debated on consensus and skeptic websites and blogs. Some representative Consensus and Skeptic sites with at least a reasonable amount of scientific basis are linked on the left navigation column. One constant debate is the importance of undersea and terrestrial volcanoes in contributing CO2 and the cooling effect of the ash cast into the sky. The photo shows Mount Tungurahua active in July 2007. Click on Mount Tungurahua for larger version and text (Source: www.OceansArt.us).
What are the views of the IPCC Process by the Skeptics?
- Very Few Scientists. Few scientists are actually involved in writing the materials, perhaps a few dozen. Usually there is one real leader, a Chair or Co-Chair and 2 or 3 titular co-chairs that often are present to provide balance for the developing nations. Because of skill or language barriers they may not be greatly involved. Lead Authors are usually involved in just one piece of the section or chapter. These few people, depending on the breadth of the chapter, prepare the first and subsequent drafts and the Executive Summary that feeds into the SPM, long before the draft chapters have been through national reviews. Even here, the Co-Chairs decide which inputs are to be accepted, or make recommendations that usually are sustained, during plenary sessions. Yes, thousands of scientists review the IPCC documents, but usually only those parts that impinge on their own expertise, which is usually quite narrow.
- Falsification of Data. With
the advent of ClimateGate (hacked
emails among the IPCC elite modelers and data gurus), this is a new
point of contention. What many suspected for a long time when they
couldn't replicate IPCC results, and could not access the IPCC-used
data, seems to be true, at least to them. The fallout could be immense.
One thing is certain, we now know how the Medieval Warm Period was
surpressed to make the current warmth appear "unprecedented" and
how the present stabilization (or perhaps cooling) has been hidden. From:
Phil Jones To: ray bradley ,mann@XXXX, mhughes@XXXX Subject: Diagram
for WMO Statement Date: Tue, 16 Nov 1999 13:31:15 +0000 Cc: k.briffa@XXX.osborn@XXXX
Dear Ray, Mike and Malcolm, Once Tim’s got a diagram here we’ll send
that either later today or first thing tomorrow. I’ve just completed
Mike’s Nature trick [This is how the Medieval warmth was
hidden] of adding in the real temps to each series for the
last 20 years (ie from 1981 onwards) amd from 1961 for Keith’s to
hide the [present] decline. Mike’s series got the annual
land and marine values while the other two got April-Sept for NH
land N of 20N. The latter two are real for 1999, while the estimate
for 1999 for NH combined is +0.44C wrt 61-90. The Global estimate
for 1999 with data through Oct is +0.35C cf. 0.57 for 1998. Thanks
for the comments, Ray. Cheers Phil Prof. Phil Jones Climatic Research
Unit Telephone XXXX School of Environmental Sciences Fax XXXX University
of East Anglia. Also see Our
Climate Change and ClimateGate Positions. ClimateGate
Articles:
- Time Magazine: As Climate Summit Nears, Skeptics Gain Traction
- Washington Post: In e-mails, science of warming is hot debate
- BBC News: Climate e-mail hack 'will impact on Copenhagen summit'
- Wall Street Journal: Climategate: Science Is Dying - Science is on the credibility bubble
- Science: Stolen E-mails Turn Up Heat on Climate Change Rhetoric
- Overstatement of Risks and Impacts. We know from
the paleo record that the Earth routinely goes through climate swings
greater than IPCC projects, yet IPCC does not go far enough in correcting
overstatements in its own documents and in those of the press. There
will be winners and losers, but always we hear only of the losses.
Balance is missing. Things
will be different, but not necessarily worse. For example, sea level
rise has been happening since the end of the last ice age, and there
is little evidence of any significant acceleration, yet most people
believe that global warming will flood all coastal areas. The areas
may flood, just as Georges Bank is now deep beneath the Atlantic,
if this unusually long period in between ice ages continues and we
see warmth as great as the last interglacial, but flooding won't
be caused by human-derived warming, although it may contribute. Another
example is the great numbers of reports about Antarctica warming,
yet the latest IPCC
document shows that there
is no evidence of any change in temperature or ice coverage.
- Too Many People are Excluded or Their Input not Valued. This includes astronomers and geologists. Some times the exclusion is real or just perceived. Over time this tends to make the inside group of IPCC scientists more uniform in their beliefs while adding to the anti-IPCC consensus.
- Pressure is Placed on People Who Disagree with the IPCC Majority. This is evidenced by the attempted removal of at least 4 US state climatologists whose Governors have decided that conformance to the consensus view is required. The Policy Statement of their Association states that the natural variability in the climate system is very strong, that we lack the ability to predict greater than about 10 years into the future, and it is essential to collect data necessary to know if the climate is changing.
- The process leading to the Summary for Policy
Makers (SPM) is too Political.
The Skeptics have more trouble with the SPM than the underlying reports.
It is not too affectionately called "SPAM". Even though
the Scientists are present during finalization, and have sufficient
authority to make sure they can live with it, many of the national
delegations work to accomplish their policy objectives through the
report. Some Skeptics have responded by developing an Independent
SPM, based on the same underlying IPCC science documents, but with
very different interpretations. An excellent report by the Earth
Negotiations Bulletin sheds light on the process. It
is recommended reading. An excerpt follows from their report of the
approval meeting of the IPCC SPM for WG1 (2007):
"Participants discussed whether it would be clearer to state that warming of the climate system is “unequivocal” or “evident.” Participants agreed to state that warming is “unequivocal.” Canada, with Germany and Switzerland, suggested adding a reference to the accelerating trend of warming. China, New Zealand, and South Africa, supported by the Coordinating Lead Authors, opposed this, given the possibility of decadal variability, and the reference was not included in this section.
On text noting high decadal variability in Arctic temperatures, Canada, supported by Norway, suggested removing a specific reference to a warm period observed from 1925 to 1945. The Coordinating Lead Authors explained that “climate skeptics” often point to this warm spell to question the IPCC for not acknowledging such warm spells. Participants agreed to keep the reference."An excellent review of the issues and how the "consensus" has made a mistake is presented in an excellent article (written by Bob Foster) of sufficient quality to be included among the British briefing documents on Her Majesty's Treasury website.
What Does the Consensus Say About the Skeptics?
- On Somebody's Payroll. Many press articles have been written to say that scientists who disagree do so because they are being supported by oil companies or some other group with a stake in the outcome. The counter argument is that most consensus scientists have funding derived from government or university sources that are directly based on public concern and fear. It is most likely that nearly all scientists say and write that which they do because they believe it to be true. Money, whether a Federal grant, or a corporate grant, will flow to support an avenue of inquiry believed in the grantor's interest. Science is not bought in advance (usually).
- Not Mainstream Scientists. The skeptics are discredited often by allegations that they are not doing work that is germane to the climate change work, or that they are inexperienced. The countering allegation is that since one or more of any reviewers for the main scientific journals are likely to be members of the consensus, any work showing the consensus view is wrong cannot be published in a primary journal. One fact is that many of the mainline skeptics are full professors involved in climate research at major universities.
- Disproportionate Press Coverage. Consensus scientists and their allies decry all the attention the Skeptics get, when they are so few. Perhaps they are perceived to be so few because Consensus people do not see them in the room and do not realize how numerous they are becoming. Conversely the Skeptics have reached critical mass and, not seeing any consensus members in their own midst, see themselves as the true consensus. Of course, the press loves a controversy. It, along with fear, are two primary attributes that expand the audience. If anyone believes the Skeptics are some tiny minority, try using your favorite search engine to search for climate skeptics. The search will show dozens or hundreds of pro and con Skeptic arguments and websites. It will show some of the hype and hysteria on all sides of the climate arguments, as well as legitimate scientific sites and discussion forums.
Is Global Cooling Bad?
- The IPCC 2007 Reports Suggest There Will be More Losers than Winners with Warming. Imagine what they would say with global cooling! The IPCC process includes many unlikely warming scenarios. These worst-case estimates also have associated impacts, from benign to worst-case. Thus we get the 5% worst impacts that have a 5% chance of happening (a combined 0.25% likelihood) equally discussed with benign changes that are reasonable to expect. By the time summaries are written, and press releases, only the bad effects are presented. This leads to a gross exaggeration of the problems.
- Global Warming Will Actually Have More Winners then Losers. Global cooling does not. Throughout the history of human life, the Earth's livability has always been better when the climate has been warmer than cooler. Human populations have expanded the most when the Earth warmed and turned greener, whether during the middle ages or during the last 2 decades. Whether it is a fish in the ocean, a shrimp in an aquaculture pond, or a bean on a vine, it will grow faster when it is warmer, all things being equal. Humans will be quick to take advantage of a warmer climate and to adjust if it gets too warm in an area. More crops grow where it is warm or hot than in frozen ground, and CO2 is a primary food of plants - basic facts that seem forgotten. Even now, NASA satellites show that the Earth has become 6% greener as the world has warmed over the past 20 years: "Our study (NASA) proposes climatic changes as the leading cause for the increases in plant growth over the last two decades, with lesser contribution from carbon dioxide fertilization and forest re-growth" . Further, a May 2007 Nature paper shows that precipitation increases 6.5% per degree C rise, not the 1-3% used in models, making the Earth 3X wetter than models forecast. Deserts, as is known for prior warm periods, will be wetter, not drier. In the warm coastal farm lands near Guayaquil, Ecuador (near the equator) are many greenhouses, and in the cooler elevations, they are everywhere. This makes it clear how bad warming might be for agriculture.
- More People Die from the Cold than From Heat and no Place on Earth is too Hot for Humans. In Europe, more than 200,000 people die from excess heat while 1.5 million people die from excess cold (Source: Lomborg 2007 ), a point left out of most assessments. For the US, the net lower death count from global warming in 2050 is estimated at 174,000 per year (Citation in Lomborg 2007).
- The climate cooling scare of the 1970s was (and still is) real. Some of the materials were condensed by the CIA and were kept classified. See the left margin for links. In a just found (Dec 09) CIA cooling report: "The western world's leadlng climatologists have confirmed reports of a detrimental global climatic change. The stability of most nations is based upon a dependable source of food, but this stability will not be possible under the new cllmatic era. A forecast by the University of Wisconsin projects that the Earth's climate is returning to that of the neo·boreal era (1600-1850) - an era of drought, famine, and political unrest in the western world." (August 1974)
What About Polar Bears and Arctic Warming and Antarctic Cooling?
- Polar Bears have Endured Warmer Periods than are Forecast by IPCC. They evolved into their present form some 700,000 years ago (or 100,000 years ago) (or 200,000 years ago) (or before the beginning of the last interglacial) and their molars changed some 10,000 to 20,000 years ago. Importantly, polar bears were likely present in some final version of their present form, during the last interglacial (130-110,000 years ago), as late 2007 research indicates, when there was virtually no ice at the North Pole and average Arctic temperatures at that time were 5.7 to 9.5 deg. F (3 to 5 deg. C) higher than present (IPCC, 2007). This date of evolution should be determined factually, as a first step, before taking action. If polar bears survived the past interglacial, the present warming may be of little consequence. In any case, the 20 polar bear populations need to be looked at individually, in terms of their threats and adaptability, and the management systems that govern their conservation.
- Imagine if it were so cold, there were no edges for the polar bears to hunt, and with the increased energy demands, there would be major reductions in populations.
-
The Arctic Reaches Record Low Ice Coverage in 2007. The press trumpeted this every few days in the summer of 2007. Further down the page on the monitoring sites of major institutions was some additional news. Antarctic ice coverage at the same time was at or above the highest levels ever recorded. For example, see the University of Illinois Cryosphere Program. In each case, reliable measurements date only from the arrival of satellite data in the 1970s, another usually omitted fact. However, since the Northwest Passage was open to sailing vessels and explored in 1903-1905 (Gjøa/Roald Amundsen), and again in 1940-42 and 1944 (St. Roch), it is possible this recent reduction in Arctic ice is not an indicator of warming. The return of Arctic sea ice in 2008 to levels at lest 30% greater than 2007 received little attention. In April 2010, the ice extent was 3.4% below average.

Will the expanding Antarctic ice cause a new ice age?
"Science" (27 September 2007) reports that the loss of Antarctic ice triggered the last warming and eventual emergence from the last ice age. Will the current expansion of Antarctic ice coverage be sufficient to trigger the next ice age? The Arctic reached record low ice coverage in 2007, but Antarctic ice coverage at the same time was at or above the highest levels ever recorded. In each case, reliable measurements date only from the arrival of satellite data in the 1970s, another usually omitted fact. Since the Northwest Passage was navigated by sailing vessels in 1903-1905 (Gjøa/Roald Amundsen) , and again in 1940-42 and 1944 (St. Roch), this recent reduction in Arctic ice may not be an indicator of warming. Antarctic Temperature Chart from CO2Science.org. The up-to-date Southern Hemisphere Sea Ice Anomaly chart is based on the era of satellite data, beginning in 1975. The current anomaly for the last 365 days is also available.
Older Climate Change News - Starting in 1895-2006
- New York Times, Feb 24, 1895 - Prospects of Another Glacial Period
- New York Times, Dec 7, 1905 - Amundsen Navigates Northwest Passage
- New York Times Oct 7, 1912 - Sees Glacial Era Coming
- New York Times Apr 6, 1919 - Do you Think our Climate is Changing?
- New York Times May 15, 1932 - Melting Polar Ice Caps
- New York Times May 5, 1946 - Top of the World (book review includes NW passage made during WWII). Need subscription or pay.
- New York Times Feb 20, 1969 - Arctic Ocean Will Soon Be an Open Sea. Need subscription or pay.
- New York Times May 21, 1975 - Scientists Ponder Why World's Climate Is Changing; a Major Cooling Widely Considered to Be Inevitable
- Newsweek, April 28, 1975 - The Cooling World
- Harper’s, September 1958 - The Coming Ice Age (cover story). Need subscription or pay
Climate Change News Since 2007
IPCC
invites Authors for next assessment (Jan 2010)
China Daily: Sea
ice causes fishery loss (Jan 2010)
Cold grips Europe. Deaths
rise (Jan 2010)
Climate Houston: Earliest
snow ever (Dec 2009)
ClimateGate hurts
IPCC credibility (Nov 2009)
Scientist: Cooling
is real (Oct 09)
NASA: Sunspots
disappearing (Sep 2009)
NOAA: Summer
US Temps fall to average (Jul 2009)
BBC:
Child-killing
cold in Peru due to climate change (Jul 2009)
Scientists: Cooling
is a mystery (Mar 2009)
Modeler:
(Despite cooling) Warming
will be worse than predicted due to higher emissions (Feb 2009)
Snow Paralyzes London (Feb 2009)
Science: Greenland
Ice Argammedon Stops (Jan 2009)
Russians:
Ice Age Imminent. Story likely vetted with Academy of Science (Jan 2009)
US temps (best data) fall below 100+ year average (Dec 2008)
Global Sea Ice ends 2008 near 30 year average (Dec 2008)
Antarctic ice ends 2008 above mean (trend up), while Arctic
remains near mean then rises again. (Dec 2008)
Asian soot damaging
glaciers (Nov 2008)
Arctic ice refuses to melt as ordered: 30%
Above 2007 (Aug 2008)
Big Chill
in Queensland (Jun 2009)
Record Cold in Anchorage (Jul 2008)
ScienceDaily: Sunspots missing. Could signal start of cooling as in 1600s. (Jun 2008)
Nature: Antarctic
deep water cools (Apr 2008)
Will Global Warming Take a Short Break? (Jun 2008)
Soot:
60% of CO2 warming; ice loss (Mar 2008)
Sun, 69% of warming, is set to cool (Mar 2008)
Chill
deepens across world (Mar 2008)
Antarctic Ice at new
high (Feb 2008)
Coldest
winter in decades (Feb 2008)
Sun goes quiet. Cooling
is closer (Feb 2008)
NASA data: Janusary temp drop greatest Yr-Yr since 1880 (Jan 2008)
China has worst
winter in 5 decades (Jan 2008)
Ice
accumulation rate doubled since 1850 in W. Antarctica Peninsula (Jan 2008)
Russia Warns of Cold
Emergency in Siberia: -55C (-67F) (Jan 2008)
Global Sea Ice back
above normal (Jan 2008)
Snow shuts hundreds of schools in New England, after
snowiest Dec.
Snow
falls in Baghdad for first time in memory (Jan 2008)
We have only a few years to prepare before lasting
and dangerous cold arrives (Jan 2008)
Russian Academician: Cold replacing warmth for
decades to come (Jan 2008)
Florida Braces for Freeze: Temps
into the teens and 20s (F)
400 Prominent Scientists Dispute Global Warming: US
Senate Report
Snow sets New Hampshire record.
The old record was set in 1876 and Chicago snowfall at double
the 30 year average.
Polar Bears survived warmer periods. Polar
bear jawbone found.
Pope assails climate alarmists. People
come first; science must be sound.
Decrease of solar activity is harbinger of 1.5 deg C drop by
2020 (3X
the rise of the last Century)
Argentina November frost devastates agriculture. 10%
of wheat lost (Español).
Half of all warming since 1900 is due to sun say
Duke University and US Army researchers (Nov 2007). The rest
poor global data.
UN Sec General challenges states on warming. Says
real and affordable options exist.
Arctic Ocean Reverses. NASA:
not all the changes in Arctic climate are from global warming (Nov 2007)
As much as 120 centimeters of snow had fallen on the Alps as
of mid November, the
largest amount at the start of winter in more than 5 decades (Nov 2007)
Buenos Aires records its
lowest temperature for November in 90 years, 2.5 deg.C. (Nov 2007(Español)).
The Northern Hemisphere continues to restore its lost ice at
a rapid pace. As of the end of November, the
anomaly is at just 1 million sq. km., 1/3
of October's. (Nov 2007)
With rapid re-freezing of the Arctic Basin in October, the
ice loss anomaly has been cut in half as of 1 Nov. 2007.
The Antarctic
ice sheet continues at a high level, but not enough to raise the total ice
coverage trend at the global level. It is still at about the lowest point
since monitoring began in 1979. (Nov 2007)
The wind caused the Arctic ice loss. NASA
scientist Son Nghiem says "The winds causing this trend in ice
reduction were set up by an unusual pattern of atmospheric pressure that began
at the beginning of this century," (Oct 2007)
Is CO2 becoming so dense we cannot breathe?
There is no threat to our ability to breathe. Oxygen and nitrogen still make up 99% of our atmosphere. Methane, CO2 and the other greenhouse gasses make up a minuscule part of what we breathe, but they have important abilities to make the Earth warmer. The gases in the atmosphere (in order) by percent are:
- Nitrogen 78.1%
- Oxygen 20.9%
- Argon 0.9%
- Carbon Dioxide 0.03852% (publ. 23 Nov. 2009, globally averaged during 2008)
- Neon 0.002%
- Helium 0.0005%
- Methane 0.0001786% (NCAR: end of 2008)
- Krypton 0.0001%
- Hydrogen 0.00005%
- Water vapor 0 to 4%
- Ozone 0.000004%
(Source: Florida State University (2010), except Methane: NCAR and CO2)
This page updated or reviewed in September 2015